Published: 2026-06-26 · Updated: 2026-06-27 · Haqeem Zulkiflee, PfMP / PgMP / PMP / MBB
"Graduates can't get jobs."
Everyone in Malaysia knows this problem. So I decided not to solve it. I just ran Define on it — the phase where most projects are actually won or lost. Not the solution. Not the opinion piece. Just the defect, characterized forensically.
Force the problem into specifics
"Graduates can't get jobs" is a headline, not a problem statement. What is the defect, exactly?
So I locked it down. An employable graduate is someone employed in a related field, in a role that fits their qualification, within 6 months of graduating. Anything else — unemployed, out-of-field, under-leveled — is a defect.
Then I checked that definition against primary data. The result broke the framing wide open.
The magnitude swing
Against DOSM's Graduates Statistics 2024:
- Graduate unemployment: 3.2% — looks like a non-problem.
- Skill-related underemployment: 32.2% — 1.6 million graduates working below their qualification.
Same broad population. One honest change to the operational definition. The magnitude swings roughly 10×.
(A caveat: those two percentages sit on slightly different bases — unemployment against the graduate labour force, underemployment against employed graduates, all ages. The ~10× is an honest illustration of how much the definition changes the size of the problem, not a single tidy slice of one chart.)
The real defect was never "graduates can't get a job."
Graduates can't get the right job.
Then the data ran out
I wanted to build the Pareto — find the vital few. Which fields of study produce the most defects?
I had clean, official unemployment data by field (MOHE's 2025 Tracer Study). I had nothing that breaks underemployment down by field. No public source does.
So I faced the choice every analyst faces at 11pm: fabricate a clean-looking chart, or tell the truth about the gap.
I charted only the slice I could measure and labelled the rest as a named data gap. Because a Pareto is only as honest as its denominators — and you don't get to plot the trivial slice and call it the vital one.
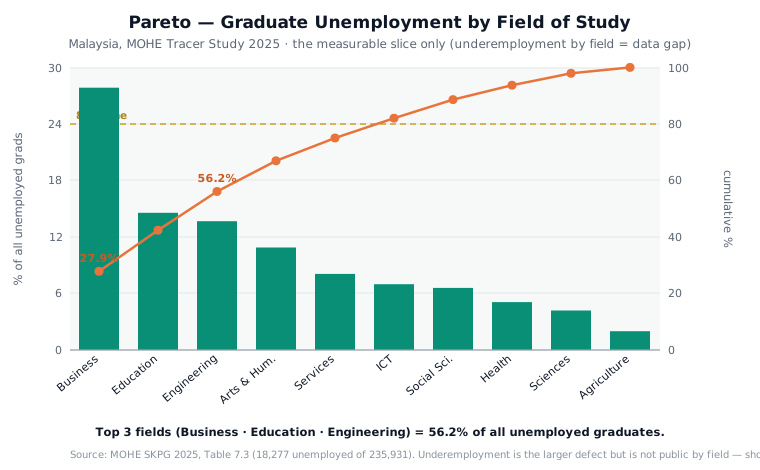 Pareto of graduate unemployment by field of study (Malaysia, MOHE Tracer Study 2025). Business, Education and Engineering together account for 56.2% of all unemployed graduates. Underemployment by field is shown as a data gap, not charted.
Even within that measurable slice: three fields — Business, Education, Engineering — hold 56.2% of all unemployed graduates. Engineering has a low unemployment rate (4.3%) yet lands third in absolute count purely because it graduates so many people. Rates and counts tell different stories; resource allocation follows the counts.
The absence of the underemployment data is not a blank I filled. It is a finding I flagged — a documented data request, not a guess dressed up as a chart.
The lesson
The popular metric is technically true and almost entirely beside the point. The binding constraint sat in a definition nobody had bothered to lock — and the honest map of it stops exactly where the public data stops.
That is the whole job of Define: not to accept the problem you were handed, not to fake the chart you wish you had, but to characterize the one that actually exists — gaps and all.
Stats are exact as published (DOSM 2024; MOHE SKPG 2025). The unemployment Pareto is real; the underemployment-by-field breakdown is deliberately left blank because it isn't public. Interpretation is mine.