Last week I put every suspect for Malaysia's graduate underemployment problem on one page — a fishbone diagram with 18 candidate causes across six branches, every one of them labelled unverified. This week the discipline demands the next step: stop treating all 18 as equally worthy of attention.
In a factory, this step has a name: the screening DOE. When you face a dozen candidate factors and can't afford to characterize them all, you run a deliberately economical designed experiment — vary every factor over a handful of runs, estimate each one's main effect, rank them, and promote only the vital few to full investigation. It is one of the most cost-effective tools in the Lean Six Sigma toolkit.
There is just one problem with applying it here: you cannot randomize a country. Nobody can assign one cohort of 250,000 graduates to "high internship quality" and the next to "low," hold everything else constant, and read off the effect. The factors of a national talent pipeline cannot be manipulated, so a true screening experiment is impossible.
But the logic of screening survives. The runs I cannot perform have, in a scattered and imperfect way, already been performed — by statisticians, researchers, and institutions who published what they measured. So this week I rebuilt the screening design on the only runs that exist: the published evidence itself.
The rules were locked before the scoring started
A screen like this has an obvious failure mode: whoever runs it already has a favourite villain, and the scoring quietly bends toward it. The countermeasure is borrowed from research practice — pre-registration. Before touching a single source, I locked a scoring rubric and a decision rule:
- Effect magnitude (0–3): how large is the published effect relative to the 32.2% defect?
- Directness (0–3): does the evidence measure skill-related underemployment itself, or only a related outcome like unemployment or wages?
- Source quality (0–2): official statistics, World Bank, and peer-reviewed work outrank think-tank reports, which outrank news and recruiter surveys.
- Consistency (0–2): do at least two independent sources agree?
Ten points maximum per factor. Promote the top cluster to formal verification, park the middle, provisionally retire the bottom. Only then did the evidence gathering begin — across the Department of Statistics Malaysia (DOSM), Bank Negara, Khazanah Research Institute, the World Bank, the MOHE graduate tracer studies, and the academic literature.
Here is what came back.
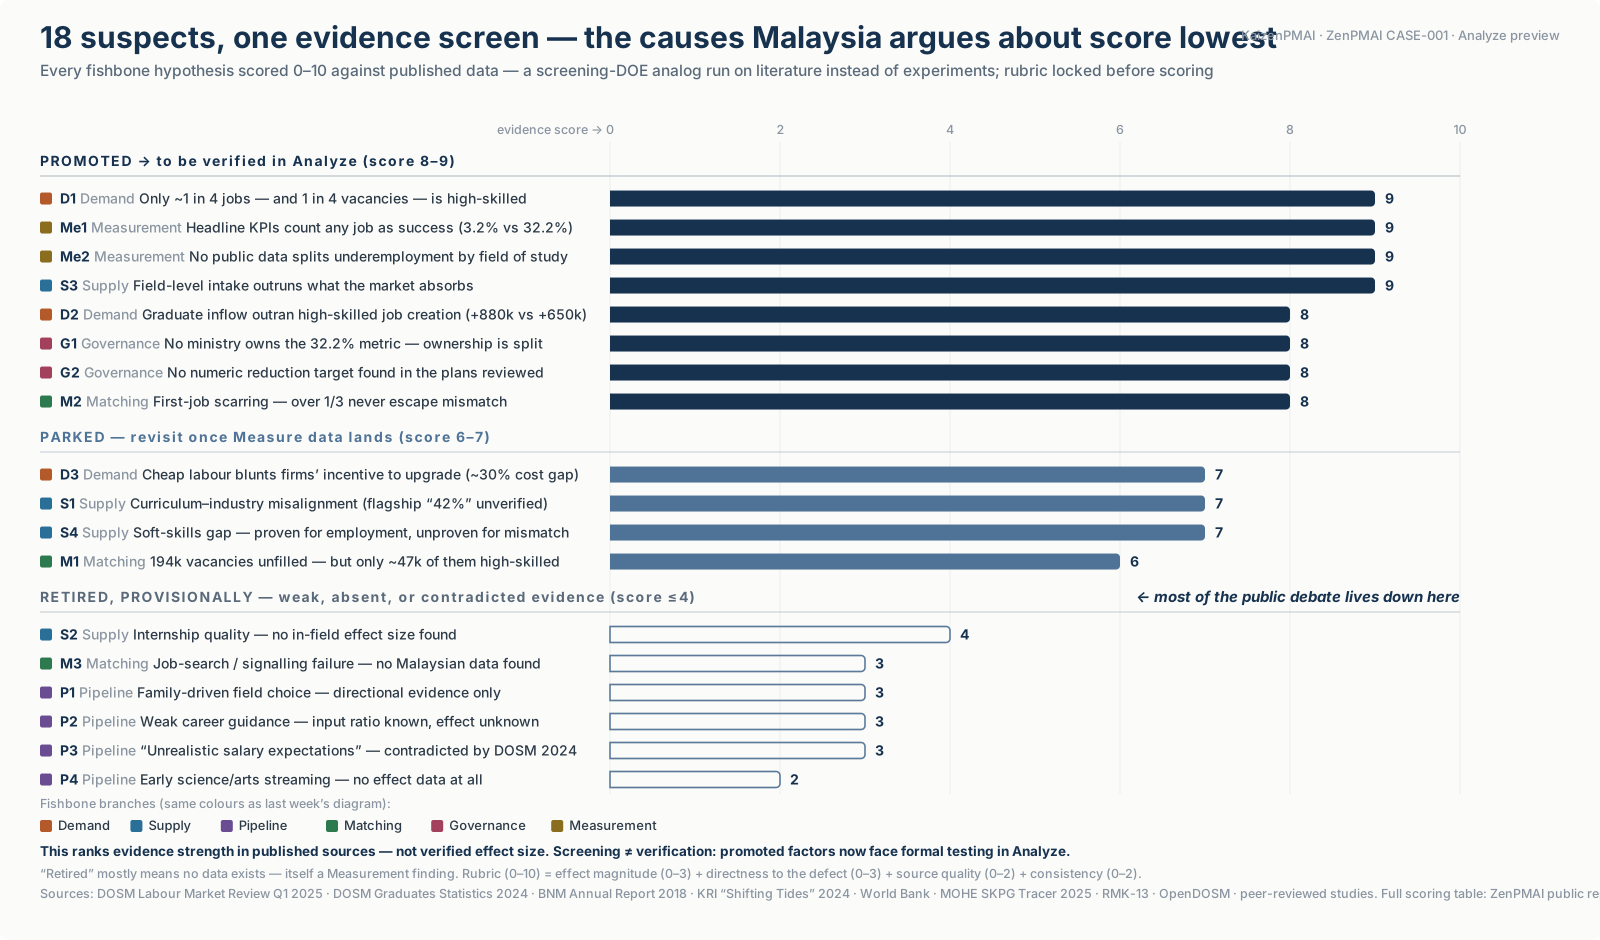 Screening Pareto chart ranking 18 candidate causes of Malaysian graduate underemployment by evidence score. Promoted with scores of 8 to 9: high-skilled job scarcity, measurement KPIs that mask the defect, missing field-level data, intake-absorption imbalance, graduate inflow outpacing job creation, split ministry ownership, no numeric target, and first-job scarring. Retired with scores of 4 or below: internship quality, job-search failure, family-driven field choice, career guidance, salary expectations, and early streaming.
Figure 1 — The evidence screen, ZenPMAI CASE-001. Bars show evidence strength on the pre-registered 0–10 rubric — not verified effect size. Sources: DOSM Labour Market Review Q1 2025; DOSM Graduates Statistics 2024; BNM Annual Report 2018; KRI "Shifting Tides" 2024; World Bank; MOHE SKPG Tracer 2025; RMK-13; OpenDOSM; peer-reviewed studies.
What screened in: four clusters nobody campaigns about
1. The economy does not make enough graduate-level work (D1 + D2 + S3, scores 8–9). As of Q1 2025, only about 1 in 4 Malaysian jobs — and 1 in 4 unfilled vacancies — is high-skilled (DOSM Labour Market Review Q1 2025: 25.1% of 9.07 million formal-sector jobs; 47,400 of 194,100 vacancies). And the flow is worse than the stock: Bank Negara's analysis found that between 2011 and 2016, the graduate labour force grew by roughly 880,000 while the economy created only about 650,000 high-skilled jobs (BNM Annual Report 2018). That comparison is dated — a current-decade update is one of the gaps this case will chase — but it is the cleanest apples-to-apples flow measurement that exists.
2. The first job scars (M2, score 8). Khazanah Research Institute's Shifting Tides (2024) reports that more than a third of graduates who start in mismatched jobs remain mismatched over time. The defect is not a queue people pass through; for a large minority it is a trap that closes in the first six months — precisely the window my operational definition targets.
3. Nobody owns the number (G1 + G2, score 8). Graduate employability is tracked by the higher-education side of government; job creation and matching by the human-resources side; the 32.2% statistic itself is produced by DOSM — and in every public document I reviewed, no ministry claims ownership of the metric and no numeric reduction target appears. The 13th Malaysia Plan (2026–2030) promises a framework to track graduate outcomes, which is genuine progress — but a framework is not a target, and a target without an owner is not a commitment. As always, this is an observation about system design, not about any administration or individual: I could not find the target in the documents I reviewed, which is not the same as proving none exists anywhere.
4. The KPIs are built so the defect never appears (Me1 + Me2, score 9). The official employability definition counts graduates who are working, studying, in training, upskilling, or waiting for placement as successes — so a graduate riding a delivery motorbike and a graduate in their matched profession score identically. Meanwhile, the public data that would let anyone locate the defect — underemployment broken down by field of study — is not published anywhere I could find; the official series slices the statistic by age and sex only (re-verified on OpenDOSM this week). Nobody measures what nobody owns.
What screened out: most of the public debate
Now the uncomfortable half of the chart. The suspects that dominate every graduation-season argument scored at the bottom — not because they were disproven, but because the evidence for them is thin, indirect, or in one case contradicted:
- "Unrealistic salary expectations" (score 3). The best-known evidence is a recruiter survey in which most fresh graduates expected around RM3,500. DOSM's Graduates Statistics 2024 reports a median fresh-graduate salary above that figure — the expectation that was branded unrealistic is now roughly the market rate. The narrative appears to have outlived its data.
- Internship quality (4), career guidance (3), family-driven field choice (3), early streaming (2). Each is plausible; none has a Malaysian study quantifying its effect on mismatch specifically. The best internship study predicts whether a graduate gets an offer — not whether the offer is in-field.
- English proficiency — a perennial favourite — was statistically non-significant in the one peer-reviewed Malaysian structural model I could find (Abdul Kadir et al., 2020; n=159, single-city sample, so treat that as one weak data point, not a verdict).
Notice what the retired list has in common: these are the causes that put the burden on individual graduates and their families. The promoted list is structural — job supply, scarring, ownership, measurement. The screen cannot yet say the popular villains are innocent. It can say that a decade of arguing about them has produced remarkably little evidence, while the structural suspects sit on official statistics nobody disputes.
A correction to my own diagram
Discipline cuts both ways. Last week's fishbone cited "86.9% of vacancies were low-skilled (2017)" — a figure that traces to one job-portal's vacancy data with a much narrower denominator than the national establishment survey. The defensible, current statement is the one above: about 1 in 4 jobs and 1 in 4 vacancies are high-skilled (DOSM, Q1 2025). The older figure overstated the imbalance, and I am retiring it from this case's standing copy. Two other figures I have used — the "42% of employers report skills-match difficulty" statistic and a widely-shared graduate-inflow ratio — could not be traced to their primary sources this week and are now flagged as unverified pending that trace.
What this screen is not
This is the part a disciplined methodology obliges me to say plainly. Screening is not verification. No factor here was manipulated, nothing was randomized, and confounding is uncontrolled — an evidence score is a measure of how strongly the published record supports a hypothesis, not of how big the causal effect is. "Promoted" means must now be formally tested in the Analyze phase, against the data being assembled in Measure. "Retired" means the evidence to justify attention does not currently exist — and since several retired factors are unmeasured rather than measured-and-small, their retirement is itself another symptom of the Measurement branch: you cannot convict or acquit a suspect nobody bothered to investigate.
A fishbone put every suspect on the table. The screen ranked them by the weight of evidence against each. The Analyze phase now has its short-list — and a mandate to test it, not trust it.
This analysis remains non-political: it examines a process, whichever institutions or administrations operate it, and the full working — rubric, scores, sources, corrections, and dead ends — is documented in the ZenPMAI public case repository for anyone to check, challenge, or reproduce.
This article is part of the ongoing ZenPMAI open research series applying industrial process rigour to public policy challenges. It sits between the Measure and Analyze phases of CASE-001, as a preview of the Analyze short-list.
Over to you: which retired suspect do you think the data will eventually resurrect — and which promoted one will survive formal testing?