By Haqeem Zulkiflee PfMP / PgMP / PMP / MBB
Last week I finished the screen. Eighteen suspected causes of Malaysian graduate underemployment went in and four came out: a structural shortage of high-skilled jobs, first-job scarring, a governance vacuum around the metric, and a measurement system that hides the defect.
Four surviving causes, and no way to run an experiment on a country. So I did the obvious thing. I went looking for a country that had implemented these things, and a country that had not, so I could compare them.
I have spent ten years watching that move fail on factory floors. Somebody finds the plant with the best yield, copies its settings, and cannot understand why the numbers do not follow.
This post is the design that stopped me, the single country that showed why that was right, and the error the design caught in my own first draft.
Why two countries cannot answer this
In a factory, when you have many candidate causes and limited budget, you run a screening design. You vary the factors deliberately, estimate each one's effect, and promote the vital few. It works because you control the settings and you randomise the order.
The unit of analysis here is a country. Nobody is going to set "apprenticeship system = strong, metric ownership = absent" for Malaysia this year and reverse it next year. So the design has to be rebuilt on runs that already exist: countries that happen to sit at different combinations.
That is a legitimate move. It comes with a rule that gets ignored constantly.
Two runs cannot separate four factors.
If I compare Germany with Spain, they differ on the training system, and plausibly on governance, and on the measurement regime, and on a dozen things I have not coded: national income, industrial structure, tertiary attainment, migration. Every effect is aliased with every other effect. The comparison produces a number. The number is uninterpretable.
The honest name for a two-country comparison is not "benchmarking." It is an anecdote with a control group.
The step that gets skipped: is it the same ruler?
Before comparing any measurements, you establish that they are the same measurement. In Six Sigma this is Measurement System Analysis, and cross-country benchmarking is a textbook reproducibility problem: dozens of different operators (national statistical offices) measuring the same characteristic with their own instruments.
So I checked.
- Eurostat's over-qualification rate: people with tertiary education (ISCED 5–8) employed in occupations classified in ISCO major groups 4–9, as a share of all employed tertiary-educated people, age 20–64.
- Malaysia's DOSM skills-related underemployment (SRU): employed individuals with tertiary education working in a semi-skilled or low-skilled job under MASCO. That is groups 4–9 of the same occupational family.
Same construction. And then the check earned its keep, because it caught me using the wrong number.
The error the design caught in my own draft
This series has been built on a headline figure of 32.2%. That figure counts degree holders only, bachelor's and above. Eurostat counts ISCED 5–8, which includes short-cycle tertiary: the diploma tier that 32.2% leaves out.
So placing 32.2% against European rates compares a narrow Malaysian population with a broad European one. The matching Malaysian series is the all-tertiary one, which for 2024 averages 36.1% across the four quarters (36.4, 36.2, 36.0, 35.8).
Four points higher than the number I was about to publish, and in the direction that makes Malaysia look worse, not better.
I am flagging this rather than quietly swapping the figure, because it is exactly the failure this post exists to warn about. I wrote a whole post on using a common ruler and then reached for the wrong one out of habit. The number was familiar, so I did not re-derive it.
For the rest of this piece, the Malaysian figure is 36.1% (all tertiary, 2024). Where I quote 32.2% elsewhere in this series, it is the degree-only slice, which remains the right scope for the case itself and the wrong scope for this comparison.
This caveat list travels with every use of this chart:
| Difference | Effect |
|---|---|
| Education boundary: Eurostat ISCED 5–8 vs Malaysia's degree-only 32.2% headline | Material, and it cuts against Malaysia. Resolved by using the all-tertiary 36.1% |
| Age band: Eurostat 20–64, DOSM headline unrestricted | Real, and bounded. The all-tertiary series has a steep age gradient (67.1% at 15–24, 25.4% at 45+, 2024 quarterly means). Dropping the whole 15–24 band would take Malaysia from 36.1% to 32.4%, so 3.7pp is the ceiling. Eurostat's window removes only 15–19 and 65+, both small slices, so the real effect is a fraction of that, but it runs toward Spain and is not measured |
| ISCED-5 boundary varies within Europe | Countries differ on which higher-vocational qualifications count as tertiary. Unresolved, and relevant to Austria below |
| MASCO vs ISCO-08 version alignment | Assumed close, not audited |
| Survey instrument (EU-LFS vs Malaysia LFS) | Sampling and reference periods differ |
Where Malaysia lands
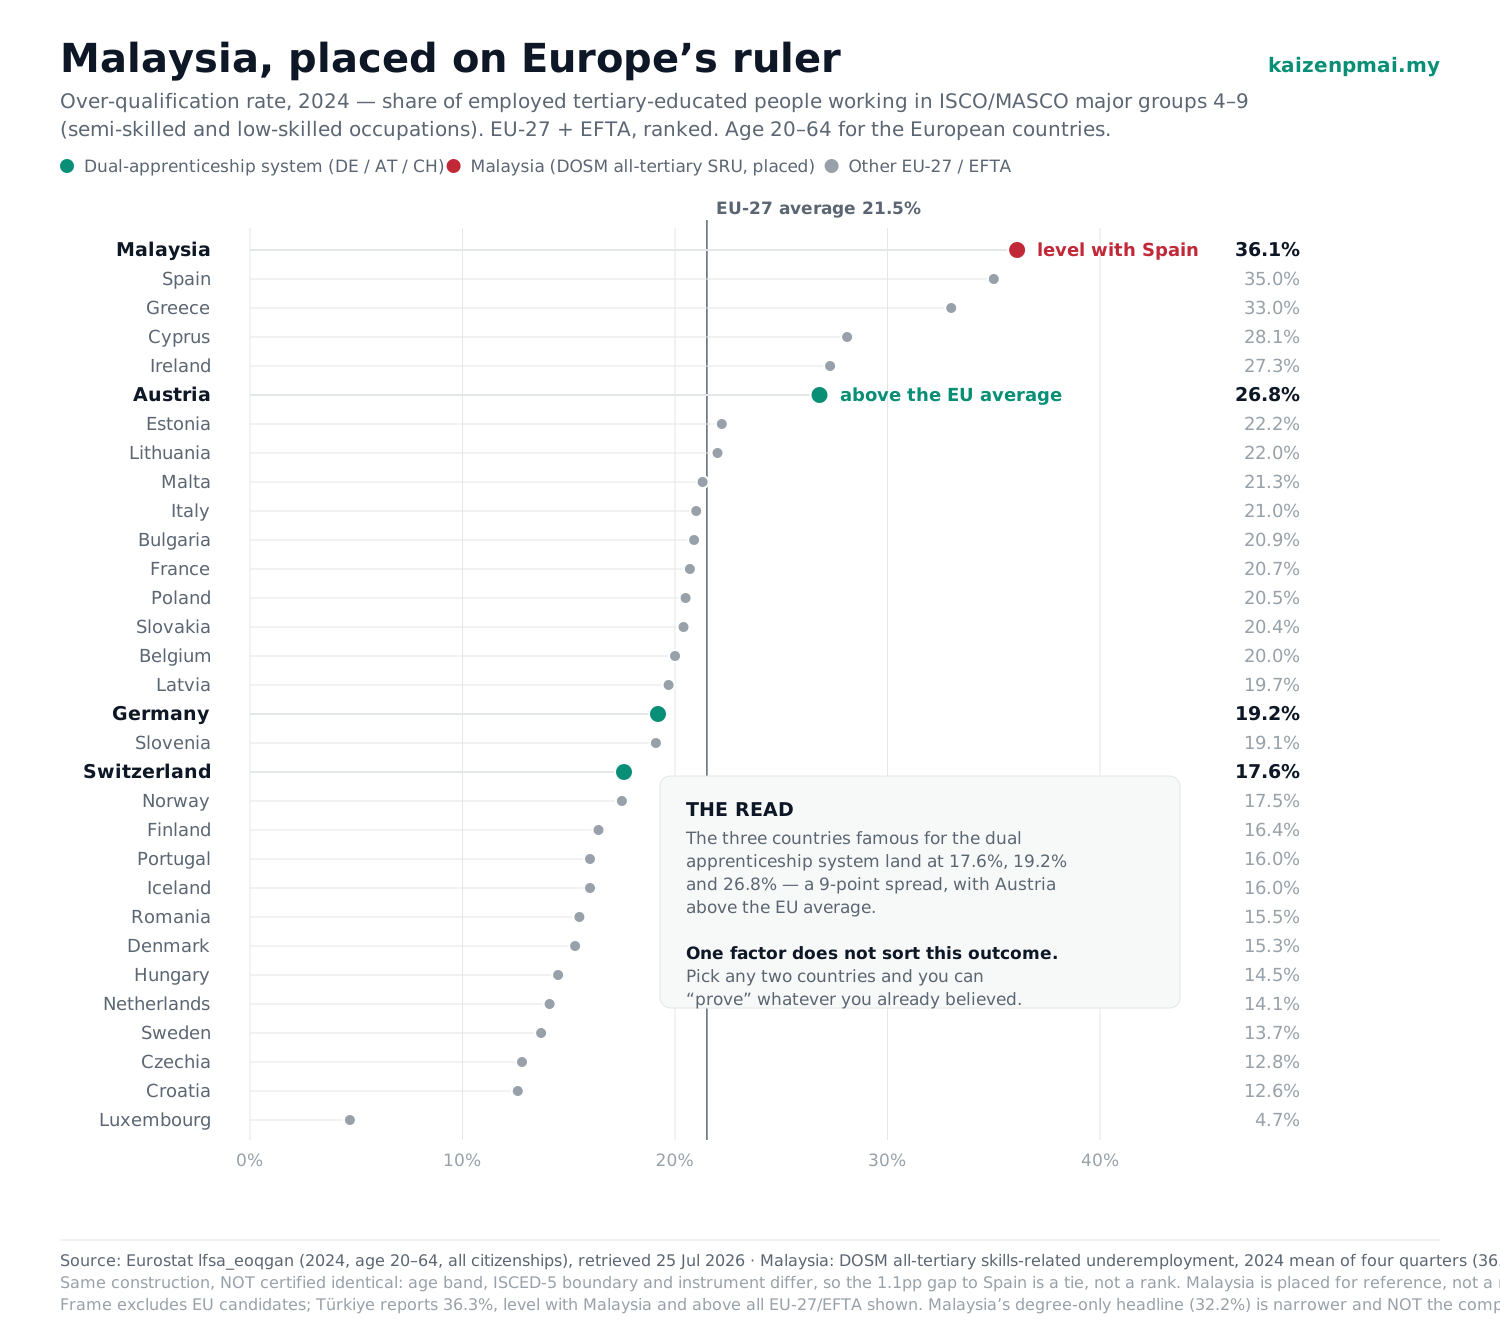 Over-qualification rate 2024, EU-27 and EFTA countries ranked, with Malaysia placed for reference at 36.1 percent, level with Spain at the top of the range
On the comparable measure, Malaysia's 36.1% sits in the top group of the EU-27 and EFTA frame, level with Spain (35.0%) and Greece (33.0%). The EU-27 average is 21.5%.
I am deliberately not ordering those three, and the caveat table above is why. The gap to Spain is 1.1 points and the gap to Greece is 3.1. Both sit inside the 3.7-point ceiling that the age-band difference alone could account for, and I have not pinned down where inside that bound the true figure falls. A separation narrower than the difference between two measuring systems does not establish a rank. It leaves them tied at the top.
What the bound does support is the group. Even at its far end, which would put Malaysia at 32.4%, Malaysia stays above every country in the frame except Spain and Greece. That claim survives the worst case; "Malaysia is first" does not.
That distinction is the whole argument of this post. Ranking Malaysia first would be a better headline and a worse measurement.
Two things about that frame, stated before anyone has to ask.
The frame is EU-27 plus the three EFTA states Eurostat reports on this indicator: Iceland, Norway and Switzerland. That makes thirty countries. Liechtenstein, the fourth EFTA member, has no data here. I have excluded EU candidate countries because their statistical systems are still converging on EU-LFS practice. That exclusion matters here, because Türkiye reports 36.3%, level with Malaysia and above every EU-27 and EFTA country shown. Admit the candidate countries Eurostat reports on this indicator and the frame becomes thirty-four runs, with Malaysia no longer alone at the top of it. I would rather hand you that than have you find it.
And the EU-27 average on this cut is 21.5%. Eurostat's own April 2025 news release quotes 21.3%. That is a slightly different cut of the same dataset, which Eurostat last updated on 30 June 2026. Neither is wrong; they are different slices, and mixing them is how spurious precision gets manufactured.
Malaysia is placed on the scale, not entered as a run. The caveats above are why.
The four causes, rewritten as things a country can actually do
The screen produced diagnoses. A design needs levers, meaning something a country either has implemented or has not.
| Factor | The lever | Level (−) | Level (+) |
|---|---|---|---|
| A | Tertiary intake calibrated to high-skilled absorption | mass academic expansion | strong employer-linked vocational track |
| B | Enforced early-intervention guarantee after graduation | none | offer within ~4 months, with delivery evidence |
| C | Named owner of the mismatch metric plus a numeric target | no owner, no target | both |
| D | Mismatch published, broken down by field of study | not published by field | published by field |
Four factors at two levels each. Then I checked whether the available runs could actually estimate them. Half the design collapsed.
Two of the four factors are not testable this way
Factor D barely varies, and checking it properly cost me the cleanest line in this post.
My first draft said every European country publishes this number broken down by field of study, leaving Malaysia as the only country that doesn't. It was the tidiest sentence here, so I went and checked it against Eurostat's full dataset catalogue rather than leave it standing. Three things came back.
Eurostat does not publish over-qualification by field of study. It carries exactly three cuts of the indicator: by citizenship, by country of birth, and by economic activity. There is no field-of-education cut of this indicator for any country in the catalogue, and I could not find an equivalent series published nationally. My original claim was wrong not by a margin but in kind.
Field-level mismatch data does exist, as a different instrument and a one-off. A 2024 ad-hoc survey module reports how well people's field of education matches their job, broken down by field. It is not the over-qualification rate, and it is a single exercise rather than a running series.
Its coverage is 28 of the 30, not all of them. All twenty-seven EU member states carry real data, plus Norway. Switzerland and Iceland are absent entirely.
So the factor is still effectively untestable, but not for the reason I first gave. It isn't that Malaysia is the sole country lacking this data: Switzerland and Iceland lack it too.
It's that twenty-eight runs sit at one level and two at the other, and the split is not a policy choice at all. The module is an EU exercise. The twenty-seven member states have field-level data because the EU commissioned it, and Norway has it through the EEA. Switzerland and Iceland sit outside that mandate. So Factor D is aliased with EU and EEA membership, which means it fails for the same reason Factor B does.
Unbalanced that badly, and aliased with the thing that determines the level, the effect is estimable in principle and worthless in practice.
I could not find anything at field level for Malaysia in public sources, which is the finding that matters for the case. But "nobody else has it either, in the form I claimed" is a materially different sentence, and it is the one supported by the catalogue.
I am leaving the whole episode in rather than editing it out, because the provisional flag is what made the check happen. Had I written that line as settled fact, it would still be sitting here wrong.
That is what a design is for. It tells you which of your questions the data cannot answer, before you spend a month answering them badly.
The right instrument for Factor D is an interrupted time series on a country that started publishing field-level mismatch, measuring the metric before and after. A cross-section cannot get there.
Factor B barely varies either. The EU Youth Guarantee has bound all twenty-seven member states since 2013. Coded as "does this exist," it is (+) almost everywhere. It only becomes usable if recoded from existence to delivery quality, which turns it into a continuous covariate needing its own data source. Demoted.
What survives is A and C: a four-corner design with roughly thirty runs in this frame, thirty-four if the candidate countries Eurostat reports are admitted.
That holds only if all four corners are actually populated. If strong vocational tracks and strong metric governance turn out to travel together across Europe, the corners will be lopsided and the interaction will be as unestimable as everything else. It is the same aliasing problem at larger n. Seven parameters (intercept, two main effects, the interaction, three covariates) against thirty runs is supportable, barely. I will know once the coding is done, and I am pre-registering now that I will report it either way.
Austria, which broke my original plan
Germany, Austria and Switzerland are the three countries most often named when people point at the dual apprenticeship system. If Factor A alone drove this outcome, they would cluster.
| Country | All citizenships | Nationals only | Dual/VET system |
|---|---|---|---|
| Spain | 35.0% | 33.6% | No |
| Austria | 26.8% | 24.3% | Yes |
| Germany | 19.2% | 17.1% | Yes |
| Switzerland | 17.6% | 16.4% | Yes |
| Czechia | 12.8% | 11.1% | Yes |
| EU-27 | 21.5% | 20.3% | — |
They do not cluster. They span nine points, and Austria, which is routinely named as a European benchmark for apprenticeship training, sits above the EU average.
I tested the most obvious explanation. Over-qualification tends to run higher among non-nationals, and Austria has a large non-national workforce, so this could be composition rather than performance. Eurostat lets me check directly, because the same table reports nationals separately. (Note the variable: this cut is by citizenship, not by place of birth. They are not the same thing and the distinction matters when you quote it.)
Restricted to nationals, Austria is 24.3% against Germany's 17.1%. The Austria–Germany gap moves from 7.6 points to 7.2. Composition accounts for four-tenths of a point of it. Whatever is driving Austria, this is not it.
So the anomaly is real, and I do not know what causes it. Two candidates, neither verified:
- A gage effect. Austria may classify some higher-vocational qualifications (BHS/HTL) as tertiary. I have not confirmed how that boundary is drawn. If it is inflating the numerator, Austria's anomaly is a measurement artifact, which would make it the cleanest possible demonstration of why MSA comes before analysis.
- An interaction. Factor A may only deliver at some level of Factor C or some covariate. That is precisely the interaction term the surviving design is built to estimate.
Either way, the conclusion is the same: a model with main effects only is misspecified. Had I picked Germany and Spain, the intuitive pairing and the one that makes a clean story, I would have concluded that apprenticeships fix underemployment, with no way of knowing the result was an artifact of which two runs I chose.
(Ireland, at 27.3%, is a second high outlier I also cannot explain yet.)
What still has to be measured
Because nothing here is randomised, confounders have to be measured and adjusted, not assumed away:
- Tertiary attainment rate. More graduates competing for a fixed pool of skilled roles raises the rate mechanically
- Share of national employment in ISCO groups 1–3, which is the actual supply of skilled slots
- GDP per capita and economic complexity
- Non-national share of the tertiary workforce (already pulled)
- Youth Guarantee delivery quality (the demoted Factor B; not yet pulled)
The limits, stated up front
- No assignment and no randomisation. This ranks and associates. It does not prove.
- One time slice (2024). A policy enacted in 2019 and one enacted in 1969 are coded identically.
- Two of four promoted causes are out of reach of this design entirely. Factor D's coding has now been checked against the Eurostat catalogue and was partly wrong as first written; see the correction above.
- Confounding remains after covariate adjustment.
- The gage differences are declared but not certified; the ISCED-5 boundary question is open.
- A designed comparison narrows the field. Root-cause verification still happens in Analyze, against Measure-phase data.
A correction, while I am here
Beyond the population error above, one more. In the short-form copy for this series I have been glossing the 32.2% as graduates working outside their field or below their qualification level. DOSM's metadata defines skills-related underemployment purely by occupation skill level: semi-skilled or low-skilled under MASCO. There is no field-of-study component in it.
The irony is not lost on me. Field-level mismatch data is the very thing Factor D says Malaysia does not publish, so it could not have been inside the number. The earlier long-form post drew the distinction; my short-form copy collapsed it. The correct gloss is employed in semi-skilled or low-skilled jobs despite holding a degree. Note that 32.2% is the degree-only series, so "tertiary" is the wrong word for it either.
This is not the first figure this case has made me retire or restate, and it will not be the last. That is the method doing its job.
What is next
Code Factors A and C for each country from documentary sources, dated and locked before any model is fitted, so I cannot code my way to the answer I already like. Pull the covariates. Verify the field-level publication claim. Close the Austria gage question. Then, and only then, estimate the model.
A design does not get you to the answer faster. It tells you in advance which answers your data was never going to give you, and occasionally it catches you holding the wrong number.
Data: Eurostat lfsa_eoqgan (2024, age 20–64, all citizenships and nationals), retrieved via API 25 July 2026. Malaysia: Department of Statistics Malaysia, skills-related underemployment, all-tertiary series, 2024 quarterly mean, retrieved via api.data.gov.my 25 July 2026. This is a public methodology case study examining a process, not any administration.